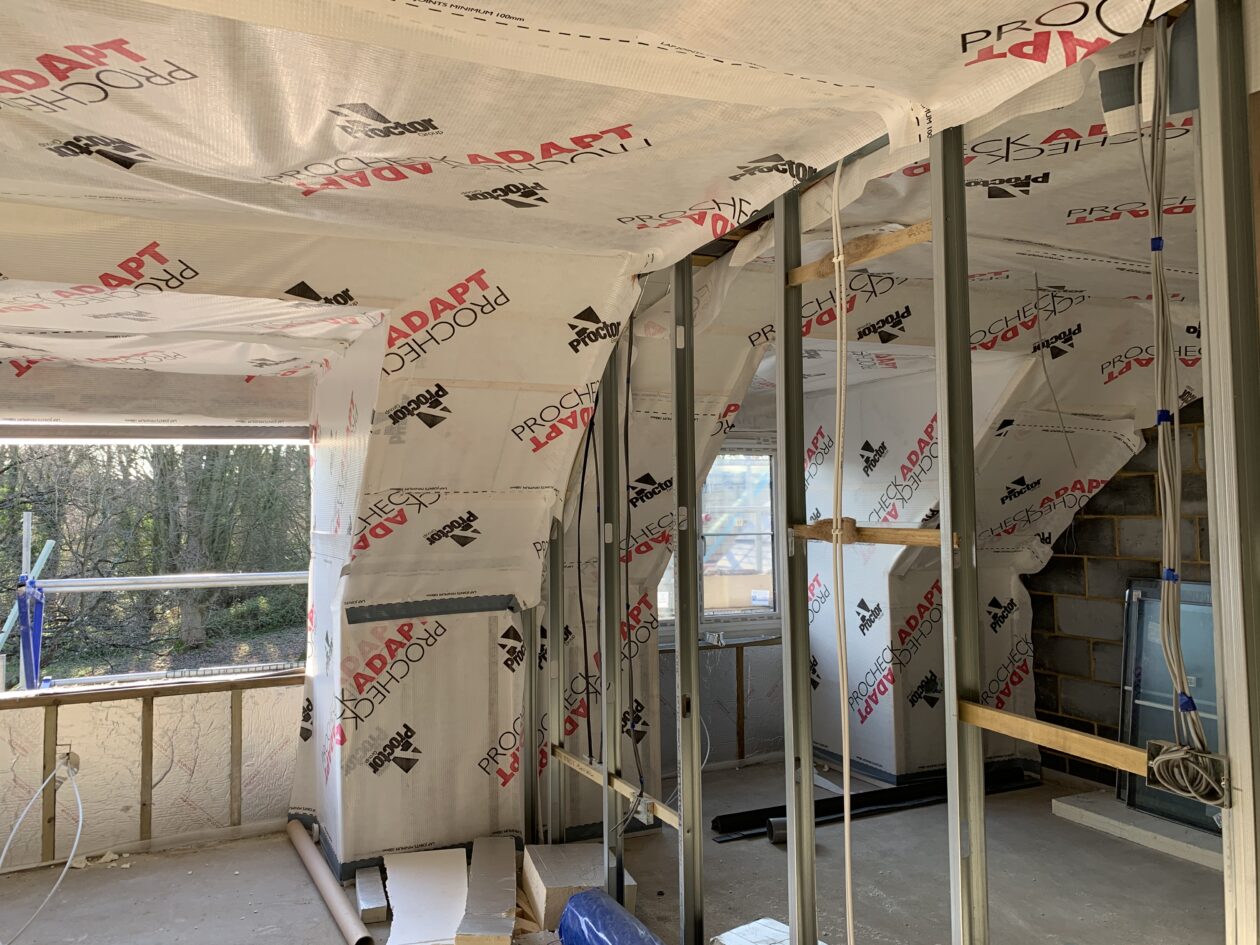
In the drive towards zero carbon and improve energy efficiency of buildings, the solid walls upgrade can cause problems, which are not readily highlighted within the existing Glaser method of condensation prediction.
The problem with existing solid walls is not always recognised and designers would be wrong to assume the conditions are likely to be similar to any other wall conditions. The existing walls, in their current state, will be breathable, and can withstand precipitation as they will dry out throughout the year and there is nothing in place to stop this vapour movement externally or internally, with either a vapour control layer or render.

When an upgrade of internal insulation is introduced the whole dynamic of the wall is changed, as depending on the insulation and VCL layer, vapour cannot pass through the wall and heat cannot dry out the wall from internal heat drive. This can be detrimental to the wall structure.
The current housing stock in the UK of solid walls, and hard to treat walls, is causing a serious issue on how best to address the thermal solution.
Design Guidance - Avoiding Moisture Related Problems
Professionals involved in the design and construction of buildings should consult BS5250: 2011 ‘Code of practice for control of condensation in buildings.’ As an authoritative voice within the industry BS5250 states the following:
‘In order to avoid the occurrence of excess condensation, which can result in mould growth and damage to building fabric and/or contents, designers should assess the amount of water vapour likely to be generated within the building and determine the resultant increase in internal vapour pressure above that of external air. They should then give careful consideration to the physical properties of the external envelope separating inside from outside.’
‘Designers should consider the effects of the external climate, which, being site related, is beyond direct control but may be moderated by the building’s form and orientation in relation to topography, prevailing winds, sunlight and over-shadowing.’
‘Designers should also bear in mind that the rate at which humidity is generated can change over time as buildings are adapted to different functions or levels of occupancy; furthermore, the cost of energy might well deter occupants from maintaining an adequate heating regime.’
Assessment Methods – Measuring the Risk of Condensation
Key guidance on assessment methods in relation to the risk of condensation in buildings is given within BS EN ISO 13788:2012 ‘Hygrothermal performance of building components and building elements. Internal surface temperature to avoid critical surface humidity and interstitial condensation. Calculation methods.’
BS5250 makes the following recommendations with regard to risk assessment:
‘Designers should assess the risk of surface condensation, mould growth and interstitial condensation using the methods described in BS EN ISO 13788, which determines three criteria for assessment.
1) The design of the structure and the heating system should ensure that, over the coldest month, the average relative humidity at internal surfaces does not exceed 80%, the limit for mould growth.
2) Any interstitial condensation, which might occur in winter, should evaporate during the following summer, preventing an accumulation of moisture year on year.
3) The risk of degradation of materials should be assessed in terms of the maximum level of condensate, which might occur.
Accuracy of Risk Assessment Methods
There is a growing understanding of the importance of condensation control for all areas of the building envelope, in order to control moisture, and protect both the building fabric and the health of its occupants. Previously the methods for the assessment of the likelihood of condensation have been limited and at best offered a simplified average with limitations.
BS5250 highlights the need for greater accuracy of measurement with the following statement: ‘Designers should be aware that BS EN ISO 13788 considers only the risks arising from the diffusion of water vapour through the building fabric; it does not take account of the much greater risk of condensation occurring as a result of air leakage, which transports water vapour through gaps, joints and cracks in the building fabric.’
In order to provide designers with more clarity in the methods of assessment available and their uses, we have outlined a summary between the traditional Glaser method and the latest software using the WUFI method of calculation below.
The Glaser Method
Traditional methods of assessment have in the past been based on the Glaser method – a standard static interstitial moisture calculation. More designers are recognising the limitations of this method, which offers a simplified approach, developed back in 1958 for use in lightweight buildings.
The simplified calculation used by the Glaser method is based on average monthly temperatures, vapour pressure and steady state conduction of heat to determine if critical condensation points are reached within one year.
The Glaser method identifies vapour diffusion, how easily water vapour can pass through the fabric of the building. However, limitations of this approach are that Glaser assumes vapour moves only one way (inside to outside). It completely omits the key feature of driving rain from its calculations, does not measure absorption or porosity, and therefore misses the potential risk attributed to the aspect of moisture storage.
To quote BS EN ISO 13788, ‘the method assumes built-in water has dried out and does not take account of a number of important physical phenomena including:
Hygrothermal Assessment
An alternative standard is increasingly being recognised as the way forward. BS EN 15026:2007 ‘Hygrothermal performance of building components and building elements. Assessment of moisture transfer by numerical simulation.’
Hygrothermal assessment is based upon the analysis of heat; vapour and moisture transfer through the elements of a building. The data provided by this method of assessment provides an accurate measure to the temperature, relative humidity and water content within the elements of a building measured over a specified time period.
The use of hygrothermal assessment employs sophisticated computer modelling to simulate the interactions between building envelopes, building services and the use of buildings. Hygrothermal analysis will consider different climatic conditions and realistically evaluate the potential moisture levels in building components, identifying weaknesses, and thus enabling these to be corrected at the design stage.
A number of the benefits of using methods of hygrothermal assessment include the following:
The WUFI Method
The A. Proctor Group advises its customers using WUFI® software, which is fully compatible with BS EN 15026, and dynamically predicts moisture movement and storage as well as condensation for each location. Using WUFI® enables architects, designers and developers to identify the likelihood and risks of condensation, and enables designs to be optimised for longevity of the building fabric, and for the health and wellbeing of the buildings occupants.
WUFI® is an acronym for Wärme Und Feuchte Instationär, which, translated, means heat and moisture transiency.
WUFI® software was developed by the Fraunhofer Institute for Building Physics in Germany and provides detailed heat and moisture calculations based on local climate conditions for building materials, multilayer components and even whole buildings.
The designer is able to achieve a minute-by-minute prediction over a given period of years, as specified by the designer. The programme considers a worst-case scenario with the injection of a moisture source at the source to predict the robust drying out of the fabric build up.
A further enhancement of using the WUFI® software is that external weather including driving rain and solar radiation is predicted in a cycle and the designer can choose the specific internal environment that the building will be exposed to. This has proven invaluable when assessing the correct position for vapour control and vapour permeable membranes to ensure a healthy building fabric, whether it be roofs or walls.
BS5250 Update
BS5250 will shortly be amended to specify the conditions when the simplified Glaser modelling is not appropriate and when the more sophisticated modelling to BS EN 15026 is needed. WUFI® can be used to carry out this modelling.
The A. Proctor Group will continue to offer this service to customers who are utilising its products to ensure that their building envelope remains healthy, and effectively ensures that the balance of heat, air and moisture is addressed to achieve the ultimate performance.
Glaser vs. WUFI Method Comparison
| BRE ICond 2.03 (Glaser) | |
|---|---|
| Inputs | |
| Product: | name; thickness; thermal conductivity or resistance; vapour resistance or resistivity; ventilation (binary – yes/no) |
| Climate: | monthly avg internal/external temps; monthly avg external RHs; set internal humidity classes (1-5); multi choice calculation period – 2, 5, 10, 20 or 50 years |
| Conditions: | multi choice – wall, roof, floor, basement |
| Outputs | |
| Report: | construction details (inputs and calculation method); binary result (yes/no condensation); annual dew point table; annual moisture accumulation table |
| Graphs: | monthly dew points and temperatures |
| WUFI Pro 5.3 | |
|---|---|
| Inputs | |
| Product: | name; thickness; density; porosity; specific heat capacity; thermal conductivity (moisture/temp dependent); Sd-value (moisture dependent); water content |
| Climate: | accurate hourly data – temperature, relative humidity, precipitation, solar radiation; variable internal temperature and humidity; temp shift (simulate cold/warm year); variable calculation period (no limit, date-to-date); monitor positions |
| Conditions: | assembly orientation; inclination; height of building; surface resistances (based on surface material and colour, ground reflectivity, water absorption); hygrothermal sources (heat, moisture, ventilation/air leakage) |
| Outputs | |
| Report: | component assembly; R-value and U-value; product data; boundary conditions; surface transfer coefficients; calculation status and results – calc time, calc quality/accuracy; water content per layer; hygrothermal sources |
| Graphs: | total water content; water content per layer; surface temps and RHs; surface dew points; monitor position temperature and RH; monitor position dew points |
| Other: | WUFI Animation – film data shows changes in assembly over time throughout entire calculation period (temperature, relative humidity, water content) WUFI Bio – calculates risk of mould growth at any chosen point in assembly |
Case Study – Condensation Risk in The Middle East
The A. Proctor Group (APG) was asked to carry out calculations to determine the condensation risk in a metal build-up in theMiddle East climate and which APG membrane we can offer that would be the most suitable option.
Calculations were carried out using the WUFI® software which allows the risk of condensation to be modelled in a variety of constructions using pre-installed or user defined climate data.
The metal build-up was based on a standing seam roof construction as typical in the MENA region. Certain materials were not available as standard within the software and so PUR insulation was used instead of Rockwool and a separate aluminium foil layer to simulate a foil-faced insulation board.
Definitions
- Vapour diffusion – movement of water vapour through materials to areas of differing vapour pressure
- Hygroscopicity – a material’s ability to absorb moisture
- Capillary action – ability of moisture to flow through spaces i.e. porous materials (brick, stone, etc.)
Conditions
External
The data found to be the most suitable for the location being investigated was taken from the weather station at Dubai International Airport and this was input to WUFI® for calculation.
Internal
Conditions internally have been set to – 24°C and 60% as a worst case scenario for the region. The worst case was also assumed for the roof orientation, which is north facing (less warming from sun exposure) and has a 45° pitch.
Air/Moisture Sources
Running the calculation with only the material build-up and climate conditions input would give a good indication of the condensation risk however it does assume the construction is perfect. As such, an air source was included within the insulation layer directly in contact with the internal membrane to simulate leakage as this is recommended by WUFI® to show whether a construction might fail when moisture is introduced to the building.
Material Performances
WUFI® has a library of materials and relevant technical information for each including vapour resistance and thermal conductivity for each item. As specific APG products were not available in the system, some generic membrane materials were used and the vapour resistances amended (Sd) to represent the performances of Wraptite-SA, Procheck 500, and a low-resistance VCL available through Don & Low, VCL 116. The Sd values for each of the materials used are as follows.
- Wraptite-SA – Sd 0.039m
- VCL (e.g. Procheck 500) – Sd 100m
- VCL 116 (2000g) – Sd 15m
- Foil Layer (insulation) – Sd 260m
The external surface is assumed to be air open due to the installation method for standing seam sheeting as the joints between seams are not considered to be airtight seals. As the covering is normally an aluminium finish this has been included in the calculation for realistic surface absorptivity and emissivity values, and has an Sd = 50m which is considered air open.
For the internal lining, the understanding is this is normally sealed, i.e. airtight, however there may be Instances, where it is left unsealed therefore each build-up has been calculated with both sealed and unsealed internal sheeting. Unsealed seams typically have a vapour resistance Sd = 25-75m and sealed seams Sd =≥300m so Sd = 50m unsealed and Sd = 300m sealed internal surfaces were used.
Monitor Positions
Monitor positions were placed at intervals as shown below to produce graphs of the moisture levels found at each side of the insulation and internal membrane as well as external and internal surfaces.
The main focus was on the moisture humidity levels found at Positions 3 and 4 for each configuration as it is between these points that the membrane would be installed and this will have the greatest influence on vapour control. The moisture levels at Position 5 are also important due to this being within an air space which can potentially harbour mould growth and humidity here will be affected depending on the sealed or unsealed steel lining.
Graphical Results
The following pages show the humidity graphs at monitor positions 3 and 4 produced by WUFI® after inputting all the required data for each configuration. The analyses were calculated over a 10-year period to ensure moisture levels have settled to a steady state as the moisture content is expected to remain relatively constant after the initial drying out period.
A good result will show a low relative humidity, which does not exceed 80% after the drying out period as this is the threshold for the risk of mould growth.
Results Analysis
Wraptite-SA (Sd = 0.039m)
With Wraptite-SA being highly vapour permeable (low Sd-value), it does not prevent the passage of moisture therefore moisture levels on both sides of the membrane are almost exactly the same.
In the closed seam build-up the humidity at these positions fluctuates between 45% – 85%, which could allow moisture to accumulate within the air space. This appears to be the case in the Position 5 graph as humidity levels increase by around 5% more than at Positions 3 and 4.
The open seam build-up is similar however humidity levels now fall below 80% at 3 and 4, as moisture is more able to dry to the inside of the construction than it can with closed seams.
VCL (Sd = 100m)
As would be expected when using a VCL similar to Procheck 500, the humidity drops by around 10-15% between Positions 3 and 4 in the closed seam arrangement as the moisture tries to diffuse through the membrane. Similarly to Wraptite-SA, the humidity increases within the air space, as it cannot escape through the steel lining but levels are below 80% even during drying out.
There is significantly less humidity with open steel seams, again this helps the roof dry out more easily as the passage of moisture is less restricted than having closed seams. The information in the graphs indicates the open seam build-up with this membrane has the least risk of condensation or mould growth of all assessed configurations.
VCL 116 (Sd = 15m)
In the closed seam build-up, the difference in humidity at Positions 3 and 4 is reduced compared to the higher resistance VCL meaning more moisture is able to pass through the membrane (much less than is allowed using Wraptite). The levels found in this construction are generally below 80% RH however there are periods where humidity increases and mould may be an issue.
As found with the two previous membranes, the risk is reduced in an open seam arrangement and the risk of mould growth is eliminated.
Conclusions
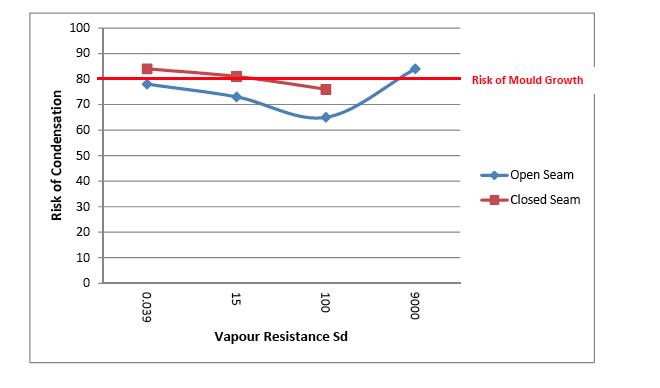
It is evident when comparing each configuration with sealed and unsealed internal surfaces that humidity levels within the air space (Position 5) are higher in a sealed build-up regardless of the vapour resistance of the membrane in place. This highlights a potential mould growth risk, as water vapour has no pathway to escape the construction and could accumulate in this area. Whilst open seams appear to be the best option, our understanding is the steel linings used for this type of construction in the Middle East are usually sealed at the joints between panels. This being the case, the analyses show Wraptite-SA would not be suitable in this arrangement due to the moisture levels exceeding 80% RH causing a risk of mould growth between the membrane and steel. This would also be true for VCL 116, although the risk is lower than using Wraptite the humidity levels are still above 80% at times which can also harbour mould growth. All membranes perform well in an open seam arrangement however we would be cautious in specifying Wraptite-SA as the moisture levels can peak at 80% RH. The 100m Sd VCL appears to be the best option as humidity is very low throughout at levels between 55-70%.
The graph below highlights the different levels of risk found using these membranes and also Profoil 861, which shows that the risk of condensation is lowest when using a membrane with a vapour resistance around Sd100m and the risk gradually increases if the membrane is too vapour permeable or too vapour resistant.
Case Study – Comparative Condensation Risk – Solid Brick Wall with IWI & External Render
Product: Spacefill and Plusboard
Location: London and Aberdeen
The A.Proctor Group (APG) was asked to carry out WUFI® calculations for a solid brick wall construction using two different insulation options, and based in two locations in the UK with differing climate conditions. The insulation products being investigated are Spacefill cavity fill insulation, and Plusboard insulated plasterboard to determine which product is the most suitable option with regards to the risk of condensation. The climate conditions used are as follows:
London / Aberdeen
- Min Temperature: -3.4°C / -6.5°C
- Max Temperature: 31.2°C / 23.8°C
- Mean Temperature: 12.4°C / 8.7°C
- Min Relative Humidity: 24% / 34%
- Max Relative Humidity: 100% / 100%
- Mean Relative Humidity: 72% / 79%
- Normal Rain Sum: 661 mm/year / 819 mm/year
- Mean Wind Speed: 3.99 m/s / 4.42 m/s
As the above data shows, Aberdeen is colder, wetter, windier, and more humid on average compared to London and as such we expect the risk of condensation to be greater in Aberdeen. The insulation materials specified, Spacefill and Plusboard, are two very different insulating materials as shown below. As Plusboard is an insulated plasterboard, the performance data for only the insulation layer, Styrofoam LBH has been used, omitting the plasterboard layer as its thermal performance is negligible.
Spacefill Plusboard (Styrofoam LBH)
- Material: Silica Aerogel/PES Fibre Extruded PS
- Thickness: 25mm 25mm
- Density: 70 kg/m3 33 kg/m3
- Thermal Conductivity, dry: 0.0255 W/m2K 0.0330 W/m2K
- Vapour Resistance (Sd): 0.025m 0.1m
To ensure the wall constructions are comparable thermally, the Plusboard wall construction was set to achieve a U-value approximately the same as achieved in the Spacefill wall (0.67 W/m2K). Although Styrofoam LBH has a lower thermal performance than Spacefill, the thicknesses of the materials are the same due to the installation method for Plusboard, which creates an air space between the insulation and the brickwork that adds to the overall thermal performance of the wall assembly. The assemblies are as follows:
Spacefill Insulated Wall Plusboard Insulated Wall
- 20mm Cement Render 20mm Cement Render
- 225mm Solid Brick Masonry 225mm Solid Brick Masonry
- 25mm Spacefill 10mm Plaster Dabs (air space)
- 20mm Lath & Lime Plaster (existing) 25mm Styrofoam LBH (Plusboard)
- 12.5mm Plasterboard (Plusboard)
All calculations have been carried out over a 10-year calculation period, which is sufficient in this case to determine if and how long it takes for each assembly’s water content to enter a steady state. Initially each component has its own in-built moisture content, which would be expected to reduce or remain the same over time as the building is heated. Generally in WUFI® calculations moisture levels tend to drop significantly in the first year or so, which would be considered the drying out period, however internally insulated solid walls can take much longer due to their mass and absorption properties compared to other wall types as well as the insulation reducing the amount of heat escaping into the brickwork to allow it to dry more quickly. An assembly is considered to be in a steady state when the moisture level is constant and no additional moisture is introduced.
As well as the interstitial condensation risk, the risk of mould growth has been considered, which can occur if relative humidity is sustained at high levels – typically over 80% RH – and the materials in question are capable of harbouring mould growth.
For ease of comparison between the locations, the graphs taken from each position in the Spacefill walls for both locations are shown on the same page, as are the graphs for the Plusboard walls.
WuFi Graphs - Aberdeen
Figures
- Total Water Content – Spacefill
- Total Water Content – Plusboard
- Temperature & Relative Humidity at internal face of Solid Brick Masonry – Spacefill
- Temperature & Relative Humidity at internal face of Solid Brick Masonry – Plusboard
- Dew Point Temperature at internal face of Solid Brick Masonry – Spacefill
- Dew Point Temperature at internal face of Solid Brick Masonry – Plusboard
- Temperature & Relative Humidity at external face of Lath & Plaster in front of Spacefill
- Dew Point Temperature at external face of Lath & Plaster in front of Spacefill
- Temperature & Relative Humidity at external face of Plusboard (Styrofoam LBH)
- Dew Point Temperature at external face of Plusboard (Styrofoam LBH)
- Temperature & Relative Humidity in Plusboard between Styrofoam LBH and Plasterboard
- Dew Point Temperature in Plusboard between Styrofoam LBH and Plasterboard
- Temperature & Relative Humidity at Interior Surface of Assembly – Spacefill
- Temperature & Relative Humidity at Interior Surface of Assembly – Plusboard
- Dew Point Temperature at Interior Surface of Assembly – Spacefill
- Dew Point Temperature at Interior Surface of Assembly – Plusboard
Analysis
As shown in the graphs in Figures 1 and 2, each assembly in both locations have lower water content at the end of the cycle compared to the initial built-in water content, which indicates they are all drying out sufficiently. As expected, both assemblies in Aberdeen take longer to dry and reach steady state water content, undoubtedly due to the lower temperature and higher humidity in this area of the UK, compared to the South of England, as can be seen in the temperature and relative humidity graphs in Figures 3 and 4.
These graphs also indicate there is no risk of mould growth in these areas as each assembly shows relative humidity is less than 80% throughout the calculation period after the first winter with the exception of the Spacefill Wall in Aberdeen, which takes three years of drying before humidity is consistently less than 80%. However the periods of high humidity are intermittent and levels regularly drop below 75% in warmer months of the drying out period.
Additionally, Spacefill is a hydrophobic material that does not harbour mould growth. Figures 5 and 6 show the temperature does not drop below the dew point temperature at any time during the calculation period thus no condensation occurs at this point whether using Plusboard or Spacefill in London or Aberdeen. In Aberdeen, the temperature in the component is much closer to the dew point than in London for both insulation types and there is the potential that water vapour could condense if there is a colder period than normal or if the use of the building produces high levels of water vapour, for example, laundrettes and kitchens/restaurants.
The remaining dew point graphs, Figures 8, 10, and 12, all show that the risk of interstitial condensation is progressively less towards the interior as the air temperature is higher internally than anywhere else in the assembly. There is also no risk of condensation forming on the internal surface of either Plusboard or the lath & plaster as shown in Figures 15 and 16.
Related Articles